After the Tax Cliff: UK iGaming Under 40% Remote Gaming Duty
 Jacob Mitchell
Blask's latest UK market data provides the first clean post-tax read on the iGaming market since the 40% Remote Gaming Duty took effect in April 2026.

On 1 April 2026, the UK doubled its Remote Gaming Duty from 21% to 40% — the largest single shift in British online gambling economics since the duty was introduced. Operators had been bracing since the October 2025 Autumn Budget confirmed the change, and the months that followed saw public restructuring, private recalculation, and visible pullbacks from marketing commitments before the new rate had even landed. If April was a transition month, May was the first clear look at how the market behaves under the new tax regime.
What it shows at the aggregate level is greater resilience than many had forecast. But aggregates hide direction. And the direction, at the brand level and in several verticals, has quietly changed.
The Market That Refused To Stall
Every headline metric for May points to stability. The Blask Index reached 49.1 million — marginally above the Q1 monthly average of 48.6 million. Monthly CEB held at $1.07B against a Q1 average of $1.05B. The Maturity Index climbed to 7.76, up 10% from April. On the surface, the UK market absorbed its largest tax change in over a decade without flinching. But the context required to read those numbers correctly significantly changes their meaning. Q1 2026 was fortified by the most concentrated sports calendar of any quarter — Six Nations rugby through February, Champions League knockout rounds through March, and the Cheltenham Festival in the final week before the Grand National handed off to April. Those are structural demand drivers that Q2 simply lacks. May's stability, measured against that fortified baseline, is not neutral. It is a better outcome than the calendar alone would predict.
Flatness is not the absence of a story. It is the story.
The directional signals that matter most emerge at the brand and category level — not in the aggregate. Operators were simultaneously absorbing the new tax rate, curtailing promotional budgets, and adjusting product configurations throughout May. Consumer demand does not respond instantaneously to cost changes inside operator P&Ls. The transmission takes weeks to months to arrive and is conveyed through product experience rather than visible pricing. May represents the leading edge of that compounding, not the full picture.
Brand Rankings: Consolidation in Plain Sight
The ranking order is unchanged from Q1. What has shifted is the velocity and direction of individual brands — and, most importantly, how demand is distributed across them. Two of the top five operators are now in accelerating decline. One is absorbing the market at a pace that raises questions well beyond this quarter.
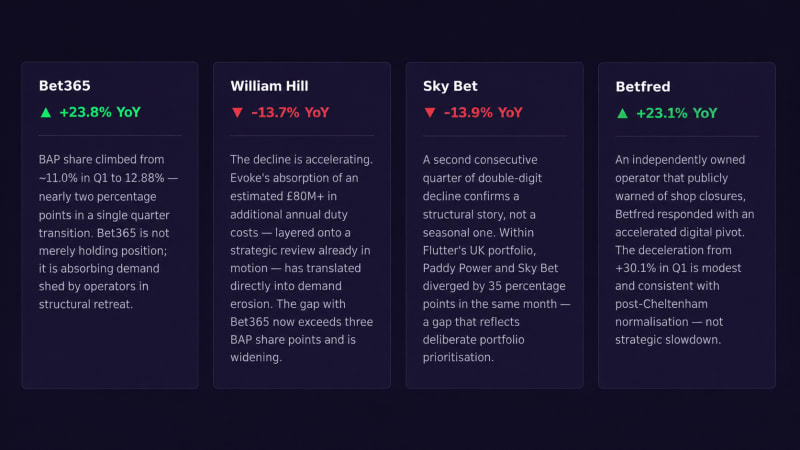
The Entain story also warrants attention. Ladbrokes at +22.1% YoY and Coral at +19.2% — operating as a deliberately paired UK strategy — have together reclaimed meaningful demand share. Their dual-brand positioning is managing post-event demand retention more effectively than many competitors, even if Coral's month-on-month figures carry more volatility than Ladbrokes. The most important market trend in May may not be contraction at all. It is consolidation — the quiet migration of demand from structurally weakening mid-tier operators toward the brands that either have the scale to absorb new costs or the digital agility seen among leading online casino platforms.

Casino Is The Real Signal
The Remote Gaming Duty applies specifically to gaming revenue — slots, live dealer, poker — not to sports betting. That distinction matters enormously for reading the category data. The tax is not hitting every vertical equally. It is hitting certain products directly, while sportsbook economics face an entirely different calculus.

Online casino games came in at +6.6% YoY — positive, but already trailing the overall market's Q1 pace of +7.1%. Operators have the clearest incentive to recalibrate here first: return-to-player adjustments and bonus compression in slots and table games are changes players absorb gradually, across sessions, rather than in a single visit. As those adjustments compound through June and July, Casino's year-on-year comparisons become increasingly demanding. It is the leading indicator for everything else in this market.
Live Dealer's month-on-month figure of +27.9% is April noise unwinding, not a recovery. Live Dealer attracts higher-value players who engage more heavily during major events, creating an elevated April base that May normalizes from. The structural read is the YoY figure: −10.3%. Live Dealer is contracting annually, even as the broader Casino category holds, consistent with the squeeze on VIP programs and high-value player economics that the new duty structure directly accelerates. Online Betting at +1.2% YoY is the most underappreciated number in the current data.
The broader market grew 7.1% in Q1; Online Betting is tracking at less than a fifth of that rate. The RGD does not directly apply to sports betting, but promotional budget cuts do. Operators facing a near-doubling of their effective gaming duty have every incentive to redirect acquisition spend toward higher-margin gaming products — and away from betting, where margins were already thin. That reallocation is now showing up in the category numbers.
What This Actually Means for Players
Under the previous 21% duty rate, Remote Gaming Duty represented roughly 26% of net gaming revenue after bonuses. At 40%, if bonus structures remain unchanged, that figure rises to approximately 50% of NGR. No operator can sustain that ratio without either compressing margins to the point of non-viability in the UK or reducing the value they deliver to players. For most players, that reduction will not arrive as an announcement. It will arrive as a series of small, disconnected observations over weeks and months: welcome bonuses that don't stretch as far; deposit match offers that appear in fewer places; casino balances that burn a little faster than they used to; VIP programs that quietly reset their tier thresholds upward; sponsored content and affiliate deals that have thinned out.
None of these changes comes with a label. None arrives on the same day. But each builds a cumulative perception — and each of them is now in motion across the licensed market. Stakeholder limits add a further layer of context. The £5 online slots stake limit for adults took effect on 9 April 2025, with the £2 limit for 18–24-year-olds following on 21 May 2025.
Those restrictions predate the RGD change and had already reshaped product economics before the duty increase landed. The combined effect on per-session casino values is consequential. Players will not consciously attribute these changes to regulation. But the compounding will be real — and it will eventually influence platform choices, even if those choices are never framed in those terms.
The Offshore Challenge Has Not Gone Away,

Offshore operators held 3.0% of UK demand in Q1 2026 and captured 11.6% of estimated revenue. Each offshore demand unit yields roughly four times the revenue of a licensed one — and that efficiency premium has held at around 3.87× for twelve months. But the stasis of the ratio obscures what is happening inside it: offshore CEB grew 18% year-on-year, meaningfully faster than offshore demand, which grew 5.3%.
Offshore operators are becoming more efficient at monetizing the UK users they reach, not less. The structural reason is not complicated. Offshore operators can offer higher RTPs, larger online casino bonuses, bonus-buy features, and full freedom from affordability-check friction. For a player who notices that their licensed platform's bonuses have quietly compressed, an offshore alternative with a more generous-looking offer is a rational choice — even if they never connect the change to regulation.
The Netherlands offers a cautionary precedent: as Dutch operators faced increased taxation and regulatory friction, the share of gambling activity captured by licensed operators declined, and recovery proved far slower than the erosion. The UK has not yet reached that inflection point. But every measure that increases compliance costs for licensed operators without equivalent offshore enforcement incrementally widens the gap. The question is not whether some leakage occurs. It already does, at 3.87×. The question is whether that ratio holds, or begins to move, as the post-RGD economics settle through Q2 and Q3.
What The Next Quarter Will Confirm or Deny
Q2 2026 is the first full quarter under the 40% regime without Cheltenham or the Grand National to inflate the figures. It is the quarter in which the structural signals visible in May either compound into something more consequential or stabilize into a new baseline. Three questions define the outcome.
Will Bet365 continue gaining BAP share? If it does, market resilience is a consolidation story, not broad growth. One brand commanding close to a seventh of all UK iGaming demand is a qualitatively different market structure than the one the Gambling Commission is currently calibrated to oversee. Concentration at that magnitude can be stable — until it isn't.
Will Online Casino's year-on-year reading weaken further? May's +6.6% is already behind the overall market's Q1 pace. As RTP and bonus recalibrations complete through June and July, annual comparisons become more demanding. Casino is the vertical most directly taxed and most exposed to offshore leakage. Its trajectory is the leading indicator for everything else.
Will the offshore efficiency gap begin to widen? The 3.87× premium has been stable for a year. If licensed operators continue reducing player value while offshore enforcement remains limited, that ratio begins to move. The near-term risk is not immediate demand collapse — it is gradual leakage in retention and engagement across multiple quarters. Slow erosion is harder to reverse than a visible crisis.
There is a fourth question beneath all three, and it is one the data cannot directly answer: whether the Gambling Commission's current priorities — focused on affordability check implementation and problem gambling harm reduction — are calibrated for a market simultaneously experiencing heavy concentration at the top, structural decline at the second tier, and a widening offshore efficiency gap. Those are not the same regulatory challenge, and each requires a different response.
May Was Only The First Chapter
The UK market has not collapsed. The Blask Index of 49.1 million sits above the Q1 average. The Maturity Index rose. On every aggregate metric, May reads as a market absorbing its largest tax change in a decade without acute disruption. Several forecasts, internal and public, were more pessimistic. That resilience is real. But the brand-level picture is different, and the directional signals are not ambiguous. Two of the top five operators by demand share are posting double-digit annual declines — and both are accelerating. The market's strongest brand is gaining BAP share at a pace that will prompt structural questions about concentration well beyond the current regulatory conversation. The vertical most directly targeted by the new duty is posting positive growth but at a slower year-on-year rate. And the offshore efficiency premium has not narrowed.
What the UK market faces is not a crisis. It faces something quieter — and harder to reverse.
Consolidation, category pressure, and offshore competition: these are the three forces that May's data has set in motion. None of them resolves in a single quarter. The compounding plays out over four or five quarters — by which point the market's structural shape will have shifted in ways that are difficult to undo. June and July will tell the fuller story. May only have told the first chapter. And the first chapter does not end with a resolution.
Blask Index measures consumer search demand derived from Google Keyword Planner and Google Trends. BAP (Brand Accumulated Power) = each brand's share of total market demand. CEB (Competitive Earning Baseline) = market-based revenue estimate from brand strength — not operator-reported financials. APS (Acquisition Power Score) = new customer volume benchmark. Maturity Index = competitive market density, updated monthly. All UK figures reflect full May 2026 unless stated. Q1 2026 baseline = January–March 2026.