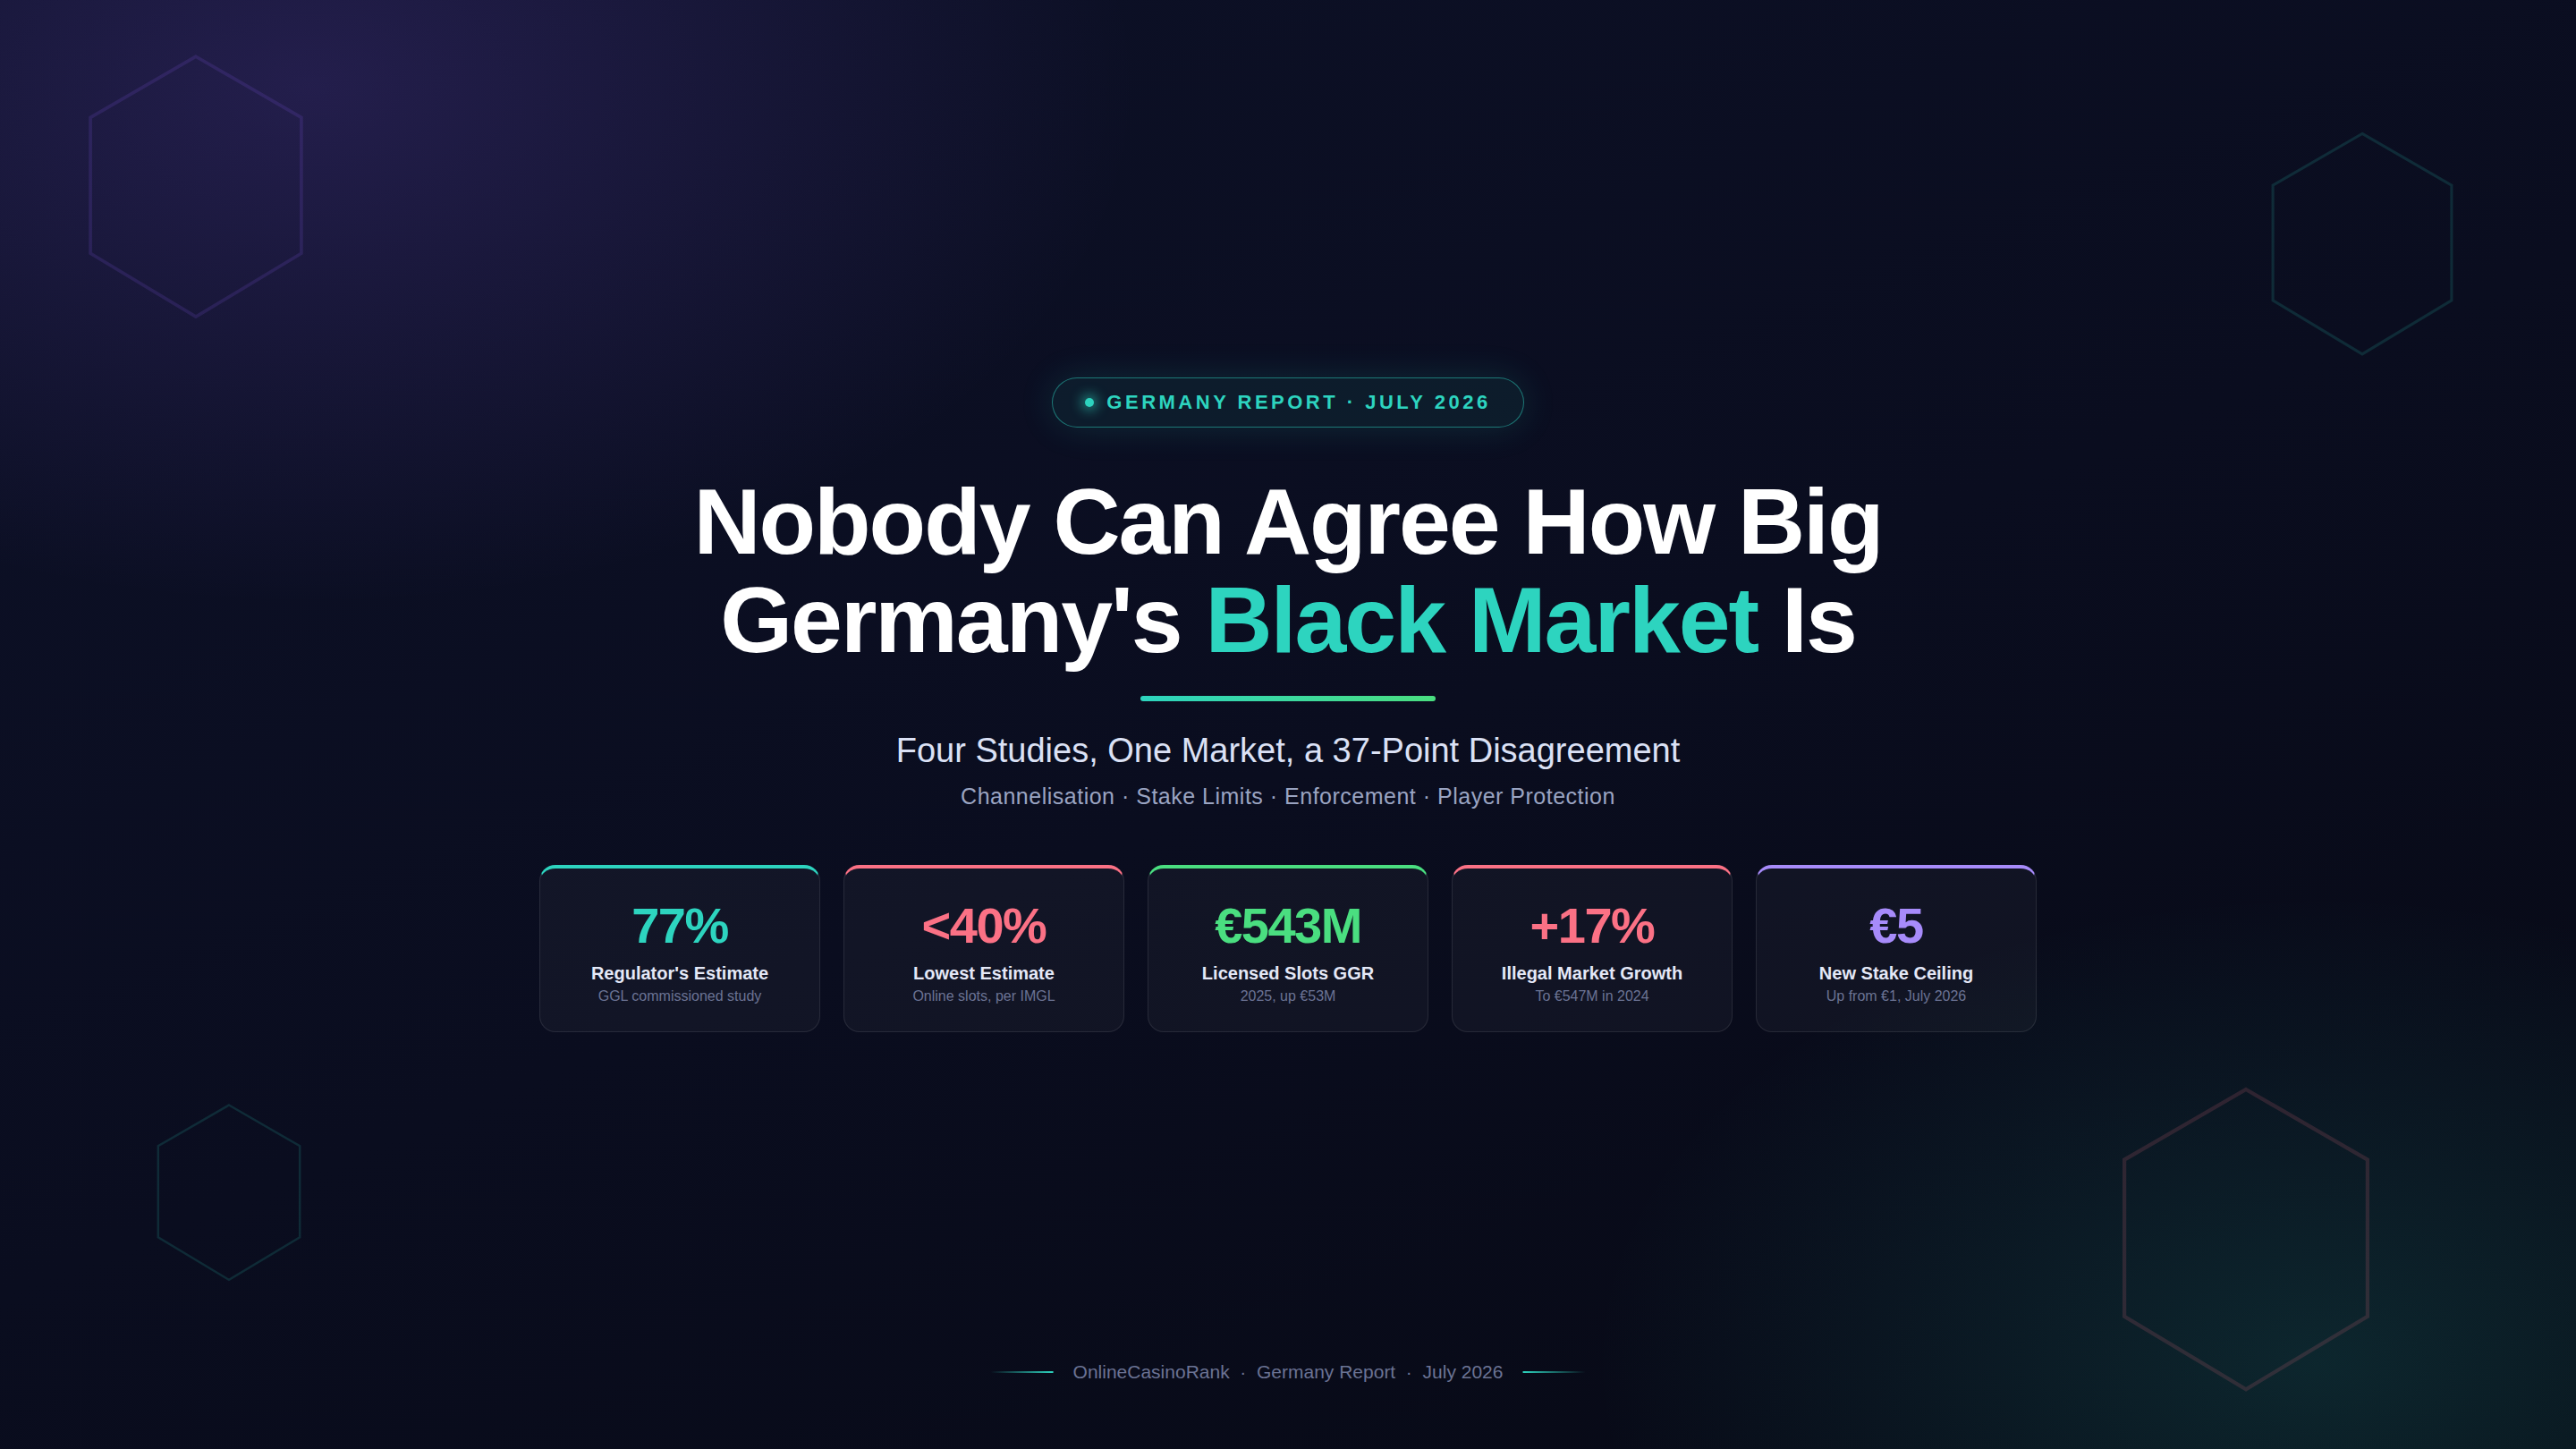
Ethiopia’s Online Casino Market Is Growing Fast—Here’s What the Numbers Say
 Jacob Mitchell
Africa’s iGaming story is usually told through the lens of South Africa, Nigeria, or Kenya. Ethiopia doesn’t get the same attention—and that’s exactly why we think it’s worth a closer look.
With a population of 118.55 million and 22.52 million internet users, Ethiopia is the second most populous country in Africa and one of the continent’s fastest-growing digital economies. Our analysis, which draws on market activity data, brand performance tracking, and a customer profile survey conducted in April 2026, shows a market that surged dramatically through 2025, experienced a sharp correction at the turn of 2026, and is now stabilizing at a new, lower—but more sustainable—baseline.
This piece is our attempt to tell that story honestly: the growth, the pullback, who the players are, what they want, and what it all means for the market going forward.
The Surge and the Correction
The headline number is a +26.75% year-on-year growth rate. But the shape of that growth matters just as much as the figure itself.
Looking at Ethiopia’s market activity from 2022 through May 2026, the market grew steadily from 2022 through mid-2024, then accelerated sharply. By November 2025, the index hit a peak of approximately 25 million active sessions—an extraordinary level for a market that was tracking at just a fraction of that for most of 2023. From that peak, activity dropped steeply, falling to roughly 4 million by January 2026 before stabilizing.

Ethiopia market activity index, all-time: steady growth since 2022, peak of ~25M in Nov 2025, then a correction to ~4M by Jan 2026.
One of the most telling signals in the data is the local-versus-international operator split. Throughout the growth phase, the index was almost entirely driven by local brands. After the January 2026 correction, local brand volume collapsed to near-zero while international operators held their ground and, by April 2026, were actually exceeding local brand traffic. This crossover is significant: it suggests the correction was driven primarily by local operator disruption rather than a wholesale market exit.
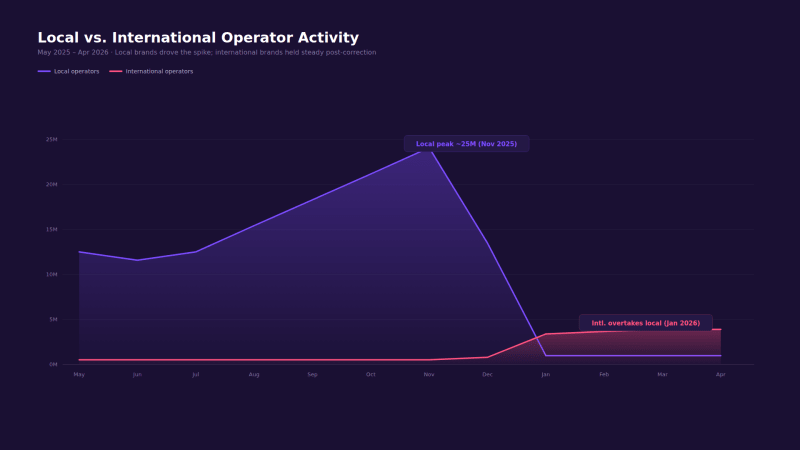
Local vs. international operator activity: local brands drove the 2025 spike; international brands held steady and overtook local after the correction.
The correction was not a market exit—it was a local brand event. International operators emerged from the January 2026 reset with more market share than they had during the peak. That is a structural shift worth watching.

The estimated player budget data reinforces this picture. At the November 2025 peak, monthly CEB reached $20M. By January 2026, the median had settled at $2.87M (min $1.52M, max $6.94M) and has since stabilized at approximately $2.43M per month.
Monthly estimated player budget (CEB): peak in Nov 2025, sharp correction to ~$2.87M median in Jan 2026, stabilizing at $2.43M.
148 Brands, but the Market Is Concentrated at the Top
There are 148 brands active in the Ethiopian market over the trailing twelve months, but the share is heavily concentrated. In January 2026—the most recent full-month snapshot—the top four brands accounted for more than 87% of the market share.
KonjoBet led with 26.52%, followed by Chatki at 23.83%, Melbet at 21.85%, and 1xBet at 14.84%. The all-time data reveal the growth story behind these figures: Melbet grew by +777.9% year-on-year, Hulusport by +592.4%, Chatki by +462.3%, and KonjoBet by +426.4%—suggesting a market that has undergone rapid structural change in a short period.

Brand market share, January 2026: KonjoBet, Chatki, Melbet, and 1xBet hold more than 87% combined.
Seasonality: When Ethiopians Play, and How Often
The seasonality data covers May 2025 through May 2026 and reveals two patterns worth calling out. The monthly distribution shows a clear second-half peak: activity is flat and low January through April, builds from May, accelerates through August, and reaches a sustained high from September through December, with November as the single highest month. This aligns with major football calendars, African Cup qualifiers, and domestic league action in the same window.
The weekly and hourly pattern tells a different story: almost no variation. Activity is distributed nearly uniformly across all seven days and across most hours. For operators, this means Ethiopian players are not clustering activity around weekends or specific times the way European or North American players often do—retention campaigns and customer service resourcing need to account for consistent demand across the full week.

Seasonality index May 2025 – May 2026: Nov–Dec peak driven by football calendars; flat weekly and hourly distribution throughout.
Who Is Playing: The Customer Profile
The customer profile data from April 2026 gives us the clearest picture of who Ethiopia’s online casino players actually are—and some of it challenges assumptions about African iGaming markets.
Age, Income, Education, and Employment
The 18–24 cohort leads at 35%, followed by 25–34 at 30%, 35–44 at 20%, 45–54 at 10%, and 55+ at 5%. Two-thirds of players are under 35. Education skews toward high school (50%), with vocational college at 20% and university at 10%. Income clusters in the 20,000–30,000 Ethiopian Birr annual range, indicating a middle-income core player. 53% are employed for wages, 20% self-employed, and only 10% report being unemployed and seeking work.
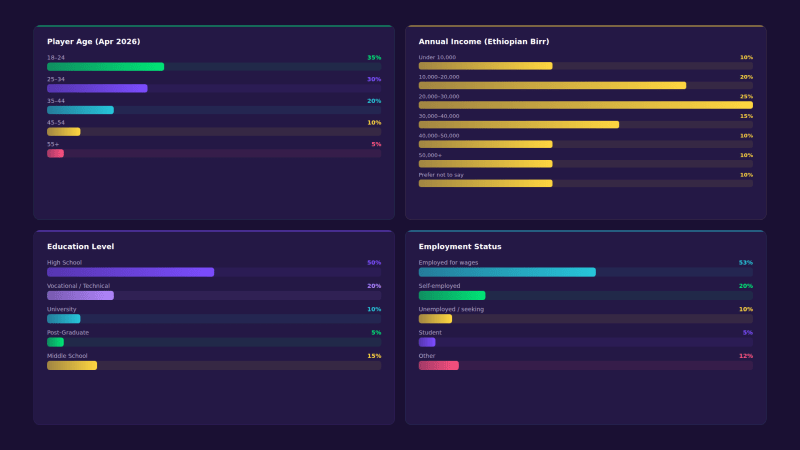
Customer profile (Apr 2026): age, income, education, and employment breakdown of Ethiopian online casino players.
Why They Play: Motivations and Products
The motivations data is the most strategically useful part of the customer profile. The single strongest driver is convenience: 75% cited the ability to play from any location as a primary motivation. Ease of access from home comes in at 70%, boredom/passing time at 65%, adrenaline at 60%, and relaxation at 55%. Financial motivation—“to earn money”—sits at 50%.
The dominant motivation is not money—it’s access. Three in four Ethiopian players say the primary appeal of online casinos is that they can play from anywhere. That is a mobile-first, infrastructure story as much as a gaming story.

Player motivations (Apr 2026): convenience and location flexibility top the list at 75%, ahead of financial motivation at 50%.
In terms of product preference, traditional sports betting dominates at 80%. Casino (blackjack, roulette, baccarat, live casino) is close behind at 60%, and slots and instant-win games, including Aviator, are at 50%. Lottery sits at 40%, poker at 30%.
Interest in promotional offers is also growing alongside casino adoption, with many players actively searching for casino bonuses in Ethiopia as a lower-risk way to explore online casino platforms.
How Players Find Brands, and What They Play
Online search is the primary discovery channel at 70%, followed by display advertising at 65%, and social media (Facebook, Instagram, TikTok, Telegram) at 60%. Friend recommendation sits at 55%—a significant share in a market where formal advertising infrastructure is limited. Telegram, in particular, functions as both a communication platform and an informal promotional channel across East Africa.

Products used and brand discovery touchpoints (Apr 2026): search and social dominate acquisition; sports and casino dominate play.
Responsible Gaming: A Market-Wide Signal
The problem gambler status data shows 65% non-problem gamblers, 20% low-risk, 10% moderate-risk, and 5% problem gamblers. That 35% combined at-risk figure is worth taking seriously in a market with no formal responsible gambling infrastructure, no mandatory self-exclusion systems, and no regulator overseeing player protection. Operators entering or expanding here have both ethical and reputational interests in proactively implementing responsible gambling tools.

Problem gambler status (Apr 2026): 35% of players fall into low-risk, moderate-risk, or problem gambler categories in an unregulated market.
The Regulatory Picture and What Comes Next
Ethiopia’s online casino and betting markets are both unregulated. There is no federal licensing framework for online gambling, no published operator allowlist, and no statutory responsible gambling obligation. This places Ethiopia in a similar position to Brazil's pre-2023—a large, rapidly growing gray market operating in a legal vacuum.
The local vs. international operator dynamic is the clearest structural signal available. When the correction hit in December 2025, it was local brands that lost volume—not international ones. That suggests that whatever disruption occurred was specific to locally operated infrastructure (payments, app availability, informal enforcement) rather than a broad market rejection. International operators with stable payment rails and global infrastructure are better positioned to weather similar events going forward.
148 brands competing in an unregulated market of 118 million people is not a stable equilibrium. Either regulation arrives and formalizes the market, or a consolidation event reshapes it again. Both scenarios favor operators with local capability and patient capital.
What We Take Away
Ethiopia is not a market that fits neatly into the standard African iGaming narrative. It is bigger and more complex than its regulatory status would suggest; its player base is more middle-income and employed than stereotypes imply; and its growth trajectory—despite the 2026 correction—shows a +26.75% YoY rate that few markets can match.
The convenience-first motivation profile tells us that product quality and mobile UX matter enormously. The search and social touchpoint dominance tells us acquisition is winnable with the right digital strategy. And the international brand resilience through the correction tells us that infrastructure quality is the deciding factor when the market moves against you.